The Lossless Lab
A field guide to the execution data missing from scientific process improvement
The FoundersAug 10, 2026

For all our talk about the “scientific method,” we often inadvertently fail to fulfill the most basic task of associating results with hypotheses by failing to adequately understand processes. An experimental outcome is meaningless without the execution context behind it. Every result is dependent on both the underlying biology and on how the protocol was physically executed; without the full picture, it can be hard to determine whether a particular result says something about biological function or simply represents an error or technical artifact. Attempts to standardize the execution of biological experiments into rigid ontologies and “universal operations” have largely been ineffective and have cast a wet blanket over the beautiful nuances of technique between scientists that can be the foundation of new discoveries. With the increasing demand for authentic, real-world scientific data from across different labs, it’s essential that we actually understand the process that generates each dataset.
When we started Transfyr, we were focused on the opportunity for observability to support handoffs - between scientists, between pharmaceutical companies and their contract manufacturers, between labs in different countries. But as soon as we deployed systems into the wild, we found an enormous need within individual labs. Understanding processes well is required for transfer but it’s also required for internal optimization.
Case 1: the plate map
Anyone who has worked in a lab knows about “plate blindness” - the realization that, when pipetting miniscule volumes of clear liquids into the tiny wells of a clear plate, you have completely forgotten which well you’re “on” (and it’s not obvious which wells have already been done). Even confident operators can accidentally skip or duplicate a well without noticing.
In one of Transfyr’s first deployments, an operator accidentally skipped a row with a multichannel pipette with 4 tips installed. She dispensed samples into wells C9-C12 while the platemap (and her lab notebook) identified rows B9-B12. When her results came back, she was suspicious that something had gone wrong, but didn’t know exactly what. The records from our sensors allowed her to confirm exactly which wells were implicated in the mistake. Importantly, the next step in her protocol was an expensive sequencing run and so knowing exactly which samples were valid, and which were not, yielded real savings for the lab.
While it’s a trivial example, it’s shockingly common. Our experience running diagnostics labs during the COVID-19 pandemic showed widespread plate mapping errors, and a cutting edge research lab we recently met with, who manages complex combinatorial libraries, shared with us that every single experiment they run has either a confirmed plate mapping error or at the minimum “suspicious wells.” Between the time saved computationally disambiguating wells and the confidence gained in experimental results, this has been one of the most widespread needs we’ve heard scientists describe.

Case 2: what is 90 seconds?
In an early academic collaboration, we were asked to investigate the sources of variance between two operators. While we found many different possibilities, one was particularly interesting. In this particular RNA sequencing protocol, creating RNA fragments of a particular size is optimal for sequencing. The duration of the fragmentation reaction directly determines the ultimate average length of the RNA sequences. The protocol instructs operators to run the fragmentation reaction for 90 seconds. Both operators set a timer for 90 seconds. When asked, both operators would tell you they were running a 90 second reaction.
The reality? One operator was fairly consistently running a 120 second reaction simply because of differences in how they set the timer. One operator would pre-set the timer and start it as soon as she started the reaction. The other operator would more casually start the reaction, then walk over to the timer and set it. When the timer went off, she’d walk back over to stop it, then stop the reaction. The result was a consistent ~30 second difference in the overall reaction timing.
The most interesting part? The operator who was deviating from the protocol was getting better results! It’s important to be clear that variance, on its own, is not a bad thing. It’s just information we need to understand the results. Unusual deviations (and unexpected results) are often the key to unlocking hidden potential, but for us to learn and benefit from variance, it must be observed.
Case 3: Not all wells are created equal
In a particularly interesting internal study, experts were performing a Pierce endotoxin assay. Typically plate maps are set up to test many different samples. In this case, we were running a simple ladder calibration and noticed, when analyzing the results, a strange “stairstep” pattern in the results. Each subsequent row looked just a little bit offset from the prior row.
For simplicity, we’ll describe the reaction in two parts: a “start” reagent and a “stop” reagent. The operator chose an 8 channel pipette for the “start” reaction and added reagent column by column. But then the operator switched to a 12 channel pipette for the “stop” reaction and added reagent row-by-row. On its own, this decision may sound strange, but it’s actually quite a common technique, often driven by the search for efficiency across different plate maps (e.g. samples may be arranged by column but reaction conditions vary by row). But in this case, where the columns were simple ladders, it became evident in the results that this decision resulted in tiny reaction timing differences for wells within the same plate.
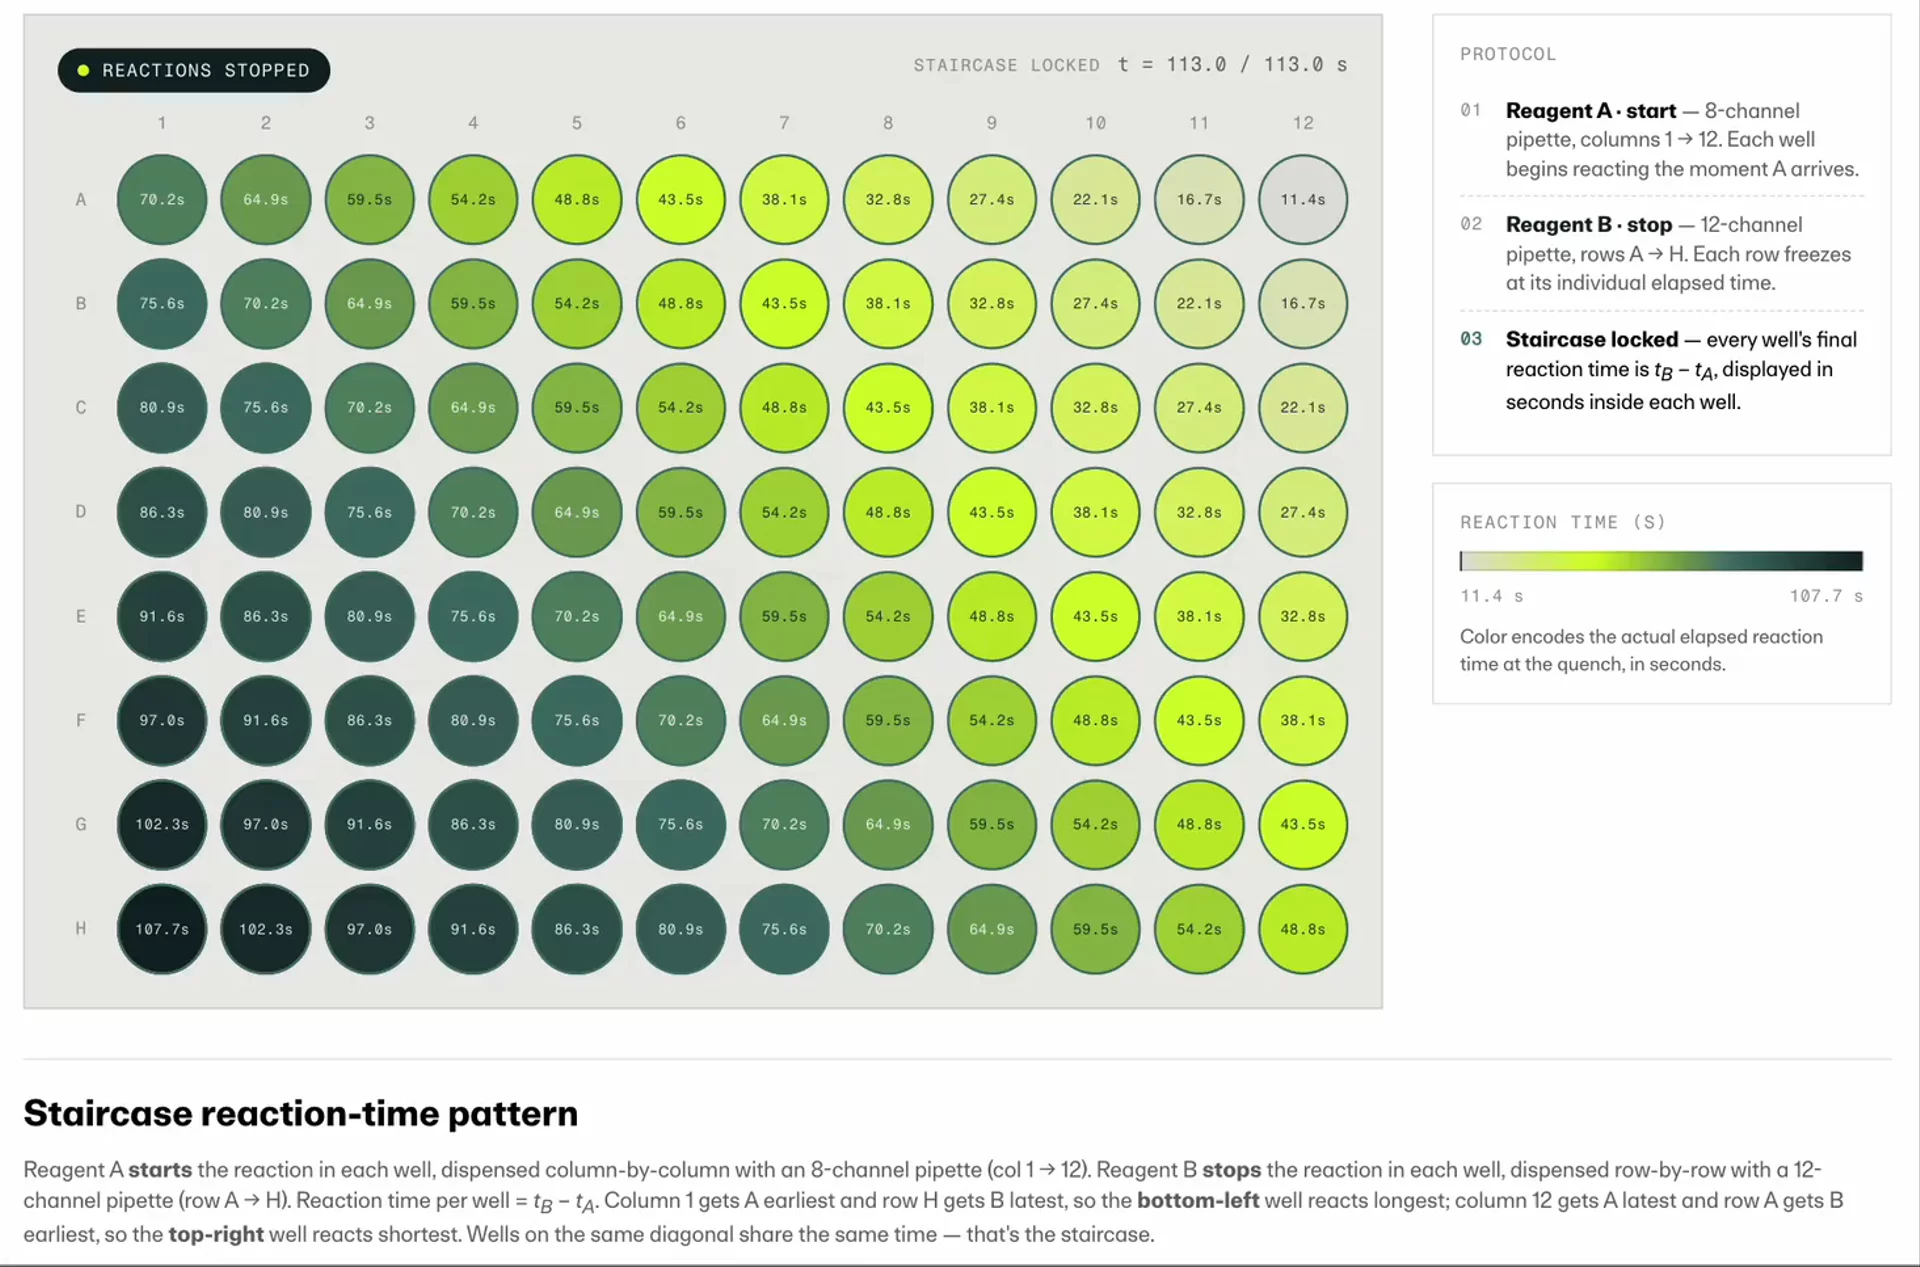
Typically variance like this would go unnoticed because there would be so much biological variability across wells within a plate that it would mask this degradation. The risk is then clear: when comparing well H1 (bottom left) to well A12 (top right), where the timing difference is maximized, the risk would be to assign a biological reason to a difference that may be entirely explainable by timing. We tend to think about macro-level validity (e.g. was the plate handled correctly), but the reality is that each well represents its own experiment and understanding the realities for each one matters.
This level of granularity becomes even more critical as labs transition from manual protocols to automated liquid handlers. Automation does not eliminate procedural nuance; it standardizes it. If we automate a flawed or poorly understood manual workflow, we risk hardcoding hidden execution artifacts directly into the machine's instructions. Uncovering these physical variables while workflows are still flexible ensures that when we automate, we capture true biological signal rather than automated noise.
Observability is the foundation for process improvement
The foundation for any process improvement or automation endeavor is simply understanding what happened in the first place.
Not what the protocol said should happen, not what the notebook captured after the fact, but what the operator, instrument, samples, and environment actually did at each step. The examples above are small by design. A skipped row, thirty extra seconds, or a different pipetting pattern are trivial details, but can each change an outcome. Without a grounded and unbiased execution record, those differences remain invisible, and teams are left to explain results with incomplete information.
A lossless record gives scientists a way to connect outcome variance to process variance, making processes more robust while preserving the deviations that may point to a better method or underlying biology. As laboratories generate more data, the limiting factor will not be the ability to produce results. It will be the ability to understand how those results came to be. The lossless lab is one where every result can be traced back to its execution—without having to recall or manually record the details—and where that record becomes the foundation for more reproducible, transferable, and ultimately better science.
And yes… if you’re not ready to throw away your lab notebooks, we’ll go ahead and fill them out for you while we’re at it (one of our most requested features!).